
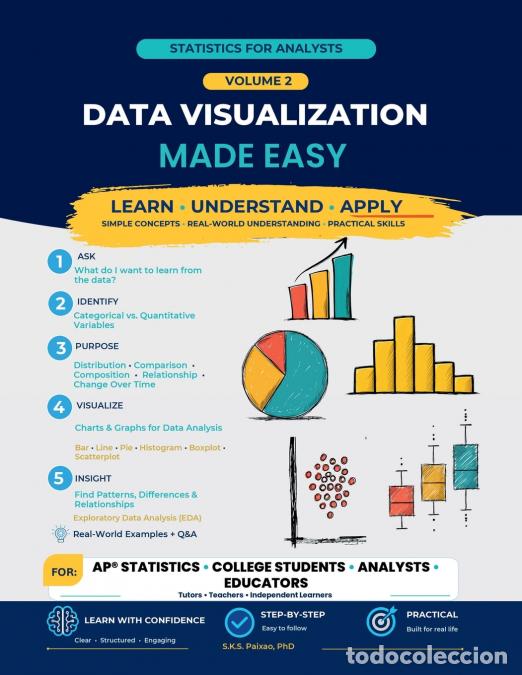
Statistics for Analysts - Data Visualization Made Easy - Charts, Data Analysis, Insights & Practical
16,79 €
Livraison à partir de 5,00€
Paiement tc
Accepte le Paiement tc
État du lot: Très bon (neuf ou comme neuf, aucun signe d'utilisation)
Impression à la demande: Ce livre est imprimé à la demande. Le délai de livraison dépend de l'impression, qui commence dès que l'acheteur paie la commande.
Paiement tc : payez par carte bancaire ou via Google Pay de manière rapide et sécurisée.
Autor: S.K.S. Paixao PhD
Editorial: S.K.S. Paixao
Año: 22/09/2026
ISBN: 9781068100635
Encuadernación: Tapa blanda
Páginas: 82 pp.
Idioma: eng
EAN: 9781068100635
Data visualization doesn't have to feel complicated. Learn to choose the right graph, explore patterns, compare groups, and turn data into meaningful insights.
Whether you're an AP® Statistics student, college or university student, aspiring analyst, teacher, tutor, or independent learner, Data Visualization Made Easy offers a clear, practical introduction to charts, graphs, data analysis, and exploratory data analysis (EDA).
Instead of memorizing chart types, learn to focus on what you want to discover from the data. Follow a structured workflow to identify variables, define your analytical purpose, choose an appropriate visualization, and find useful insights.
INSIDE THIS VOLUME, YOU'LL LEARN:
* ASK - Start With the Question: Identify what you want to learn before choosing a chart.
* IDENTIFY Variables: Distinguish between categorical and quantitative variables and understand how they shape visualization choices.
* PURPOSE - Know What You Want to See: Explore five analytical purposes: distribution, comparison, composition, relationship, and change over time.
* VISUALIZE Data: Learn when to use bar charts, line graphs, pie charts, segmented and stacked bar charts, dot plots, stem-and-leaf plots, histograms, boxplots, and scatterplots.
* FIND INSIGHTS: Recognize patterns, differences, relationships, and unusual features in data.
* Exploratory Data Analysis (EDA): Explore data before drawing conclusions or making decisions.
* Real-World Examples & Q&A: Connect concepts to practical situations and reinforce learning through focused questions and answers.
Simple concepts. Real-world understanding. Practical skills.
The ASK ? IDENTIFY ? PURPOSE ? VISUALIZE ? INSIGHT approach helps make data visualization easier to learn, remember, practice, and apply.
S.K.S. Paixao, PhD, is a data analytics post-graduate community college instructor with five years of experience teaching statistics and data analytics to non-STEM learners.
El envío se realizará en 48/72hrs.

Espagne (Guadalajara)
Vendeur enregistré en tant que professionnel.
Si vous effectuez un achat en tant que consommateur, cette transaction est soumise à la réglementation relative à la protection des consommateurs et des utilisateurs.


 Español
 English
 Deutsch
 Français
 Português
 Italiano